Research

WorldPop methods

A primary focus of WorldPop is ensuring that the methods developed and resulting output datasets undergo academic peer review. Therefore, to keep up with the latest methods, we recommend visiting our publications page. The methods outlined below are becoming outdated and have been superseded in some places – we are working to update these based on newly published papers.

A Census Database

Previous WorldPop work showed the importance of detailed, contemporary census data in producing accurate population distribution datasets, irrespective of modelling approach. WorldPop has therefore made the construction of a unique GIS-linked database of census and official population estimate data a priority, targeting the most recent and spatially detailed datasets available. The figure below shows comparisons between the ages and spatial resolution of population data used in the construction of the Global Rural Urban Mapping Project (GRUMP) dataset versus WorldPop. Summaries of the input census/population count datasets used as input to WorldPop are available for AfricaAsia, Latin America and the Caribbean. These are regularly updated and sources are provided in country dataset metadata.

Upcoming collaborations with the Center for International Earth Science Information Network (CIESIN) on global mapping will produce further improvements in terms of more recent data and higher resolution inputs.

The year of the census data within the WorldPop database for the Americas


Comparison of the spatial and temporal characteristics of population data used in the construction of the Gridded Population of the World (GPW) version 3 and the Global Rural Urban Mapping Project (GRUMP) datasets  and WorldPop data for Asia. A, B: Year of input population data. C, D: Administrative unit level of input population data.

The year of the census data within the WorldPop database for the Americas

Mapping Settlements

The vast majority of people across Central and South America, Africa and Asia reside in settlements of varying sizes, therefore, the accurate mapping of settlements-from cities to villages is important for identifying where populations reside within census units. WorldPop utilises satellite imagery for mapping settlements – specifically, 30m spatial resolution Landsat Enhanced Thematic Mapper (ETM) satellite imagery, and increasingly a range of other sources. For many countries, expert-opinion manual satellite imagery interpretation was used to map settlements. For other countries, the latest imagery of the regions of interest were acquired and subject to pre-processing and georegistration. For the country of interest, all spatially-referenced ancillary data available on settlement locations, land cover and infrastructure are gathered and used to aid computer-automated classifiers in identifying the unique multispectral reflectance and, where appropriate, image texture signatures of settlements within a specific land cover region. These signatures are then used with separate training data and visual interpretation to map settlements and assess mapping accuracies. The figures below show example settlement extent extractions for areas of Uganda and Myanmar. See Tatem et al for full details. Increasingly, WorldPop is collaborating with groups undertaking high resolution settlement mapping, and integrating these datasets into the modelling process – these include the Global Human Settlement Layer , the Global Urban Footprint and mapping undertaken by Oak Ridge National Laboratories.

(Top image) False colour Landsat ETM image of Kampala and surrounds, Uganda; (Bottom image) Automated extraction of settlements from image.
(Top image) Landsat ETM image of Yangon and surrounds, Myanmar; (Bottom image) Settlement extents used in WorldPop mapping

Mapping Populations

Land cover-based: Through detailed mapping of settlements, and linkage of these settlement extents with gazetteer population numbers, the substantial majority of resident population can be mapped within settlements with good precision. Mapping of the remaining minority rural populations follows the approaches outlined in detail elsewhere. The settlement maps are used to refine land cover data, while local high resolution census data is exploited to identify typical regional per-land cover class population densities, which are then applied to redistribute census counts to map human population distributions. This population mapping approach forms the basis of some older WorldPop datasets, but is now being replaced by an alternative ‘Random Forest’ mapping approach described below.

Random Forest: Stevens et al (2015) provides full details on the novel random forest regression tree-based mapping approach. In brief, a new semi-automated dasymetric modeling approach has been built that incorporates census and a wide range of open access ancillary datasets in a flexible, “Random Forest” estimation technique. A combination of widely available, remotely-sensed and geospatial datasets (e.g. settlement locations, settlement extents, land cover, roads, building maps, health facility locations, satellite nightlights, vegetation, topography, refugee camps) contribute to the modeled dasymetric weights and then the Random Forest model is used to generate a gridded prediction of population density at ~100 m spatial resolution. This prediction layer is then used as the weighting surface to perform dasymetric redistribution of census counts at a country level. The full code behind the approach will be published and documented soon and is available through contacting the WorldPop team. The modelling process produces accompanying metadata for each output dataset, documenting input datasources and accuracy statistics. Outputs show marked improvements in mapping accuracies over the land cover-based approach outlined above and other population mapping approached (Steven et al (2015)).

Visual comparisons of WorldPop with GRUMP and LandScan gridded population datasets. Upper figures show the North-East region of Guinea, along the Niger river using A. WorldPop, B. GRUMP and C. LandScan. Lower figures show the region around Dar es Salaam, United Republic of Tanzania, using A. WorldPop, B. GRUMP and C. LandScan.
(Top image) Input administrative level 2 census counts for northern Vietnam; (Bottom image) Output random forest-based modelled population distribution dataset.

Bottom-up population mapping: Where census data are outdated or unreliable, WorldPop has been collaborating with the Bill and Melinda Gates Foundation and Oak Ridge National Laboratories to develop approaches to estimating population distributions at high spatial resolution through a combination of satellite-derived feature extractions and household surveys. Initial outputs are being completed and will be available on the WorldPop site in 2016, with some outputs already available for Nigeria in their vaccination tracking system.

Intra-urban population mapping: To delineate, map, and predict urban extent and urban land uses in Africa, the MAUPP project works at two spatial resolutions: high resolution (HR ~30 m) and very high resolution (VHR < 5m). The urban extent is defined as the Morphological Urban Area (MUA), which is the densely populated area where most of the economic and/or cultural activities occur and all the important transportation connections to other cities take place. At the continent scale, we develop a generalizable method based on statistical models to map the urban extension and the intra-urban densities of a set of ± 50 cities mainly using SAR and optical remote sensing as input data (see figure below for selected cities). Information fusion extracted from the two datasets allows for the exploitation of redundancy, in order to increase global information and complementarity and to improve certainty and precision.

Example built-up probability for the city of Ouagadougou, Burkina Faso for 2015.
Selected African urban cities for MAUPP analyses.
Example urban land use/land cover classification for Ouagadougou, Burkina Faso.

At the city scale, we develop a semi-automated method to map urban land covers and land uses to inform spatially-detailed population distribution models. We compare results obtained at both spatial scales. In addition, spatially-detailed census data, historical maps, and existing population distribution datasets are used for modelling and predicting urban expansion and human population densities across Africa.

Mapping births and pregnancies

Full details of the methodologies used to construct the datasets depicting estimates of numbers of births and pregnancies per grid cell are available in Tatem et al (2014) International Journal of Health Geographics. In brief, age-specific fertility rates (ASFRs) by 5-year age groupings disaggregated by subnational regions and urban versus rural were derived from the most recent national household surveys conducted as part of the Demographic and Health Surveys programme. These rates were then used to adjust each 5-year age grouped female population distribution dataset described above to produce gridded estimates of the distributions of births across each country. The national totals were then adjusted to match those birth and pregnancy totals estimated by the Guttmacher Institute. The full set of births and pregnancy output datasets were recently used as the baseline data for the UNFPA’s State of the World’s Midwifery report and Analyses of the Midwifery Workforce in the Arab Region.

Example subnational age-specific fertility rates for Tanzania and output estimated births dataset
Estimated numbers of pregnancies per grid cell in 2010 for Afghanistan (top), Bangladesh (middle) and Tanzania (bottom)

Mapping age structures

Full details of the methodologies used to construct age and sex-structured population distribution datasets are provided in Tatem et al (2013) and Alegana et al (2015). In brief, for continent-wide mapping, the approaches outlined in Tatem et al (2013) were applied, whereby data on sub-national population compositions by age and sex were obtained from a variety of sources – principally from contemporary census-based counts broken down at a fine resolution administrative unit level (see figure below for Tanzania), though also from national household surveys where census data were lacking or outdated. These subnational counts and proportions were matched to corresponding GIS datasets showing the boundaries of each unit, and used to adjust the existing WorldPop spatial population datasets described above to produce estimates of the distributions of populations by sex and five-year age group. The datasets were then projected to the years of interest (2000, 2005, 2010 and 2015) through applying UN urban and rural growth rates, and adjusted to ensure that national population totals by age group, specific city totals and urban/rural totals matched those reported by the UN.

Tanzania census data showing the subnational distribution of percentage of children under 5 years old
WorldPop estimated 2015 distribution of children under 5 years old across Africa

For country-specific mapping of age structures where census data is outdated or considered unreliable, a Bayesian model-based geostatistical approach has been developed (Alegana et al (2015)), that integrates geolocated cluster survey data on population age proportions with a range of geospatial covariates. The model exploits both the spatial autocorrelation between survey cluster values and relationships with covariates to estimate age structures in unsampled locations, with full quantification of model uncertainty. The images below illustrate the input data and model outputs, and these datasets form a key components of the Nigeria vaccination tracking system.

The distribution of cluster-level data from household surveys (the DHS, MIS and LSMS-AIS).
Mean predicted percentage of population under the age of 5 years based on model-based geostatistics
Map of differences (high and low) between the upper and lower limit of predictions (i.e. the 95% Bayesian credible intervals).

Mapping population dynamics

Dynamic population mapping: Full details of the methods used to construct the datasets depicting monthly population densities per grid cell are available in Deville et al (2014) PNAS. In brief, mobile phone call data records were obtained for each country mapped and per cell tower call numbers were calculated for each month. These were converted to per grid cell call densities using Thiessen tessellations around cell towers and network coverage maps. Further, these were converted to estimates of population densities using empirical relationships between detailed census counts and call densities during the census taking period. This relationship enabled conversion of call densities into population density maps for time periods beyond the census count periods, facilitating the mapping of, for example, day/night, weekday/weekend, work/holiday difference population mapping. The video below illustrates this for France. Download Dynamic Mapping data (France and Portugal). Further datasets for low income nations will be made available soon.

Mapping domestic population movements: In collaboration with the Flowminder Foundation, the mapping of population movements using mobile phone call data records (CDRs) is ongoing for many low and middle-income countries. These involve tracking de-identified communication patterns of individual SIM cards by phone tower to estimate population flows, displacements and commuting patterns. Full details can be found on the Flowminder website, and outputs for specific countries are made available on the World Events section of the WorldPop site.

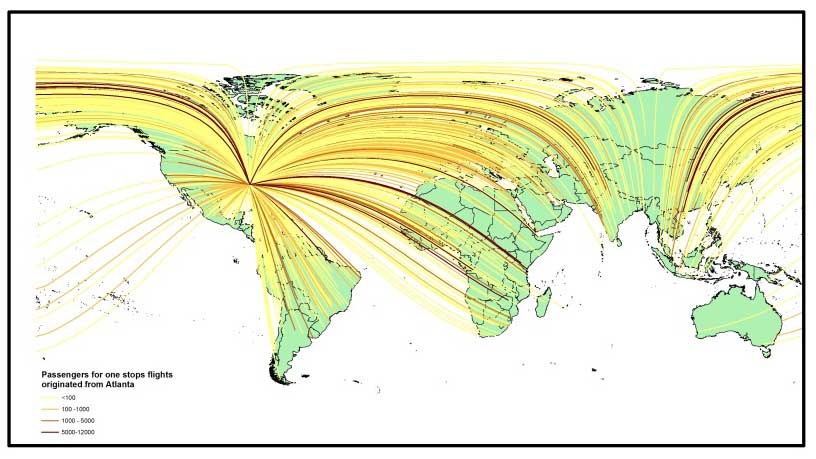
Mapping air passenger flows: Data on the numbers of people travelling via air travel between locations globally are generally difficult and expensive to obtain. Recent work described in Huang et al (2013) and Mao et al (2015) as part of the Vector-borne Disease Airport Importation Risk (VBD-Air) tool project has produced open access modelled passenger flow datasets, for both annual and monthly flows between airports globally. A set of Poisson regression models were built to predict monthly passenger volumes between directly and indirectly connected airports. The models not only performed well against ticketed data from the United States with an overall accuracy of 93%, but also showed good confidence in estimating air passenger volumes in other regions of the world. The image below shows an example of predicted flows of passengers from Atlanta making one stop on the way to their destination.

Mapping human migration: Ongoing work is focussed on quantifying and mapping human migration patterns at subnational scales globally. Comparisons against mobile phone call data records show that the internal migration flows are good surrogates for connectivity across time scales (e.g. Wesolowski et al (2013)Ruktanonchai et al (2016)).

Publicly available IPUMS-International migration microdata for 49 countries located in Africa, Asia, Latin America and the Caribbean, along with a number of push and pull factors, have been used to fit unconstrained continent-wide gravity-type regression models (for full details see Garcia et al (2014)Tatem et al (2014)Sorichetta et al (2015)).

The fitted models were then used to predict 5-year (2005-2010) internal migration flows for every country shown in the image below, (for full details see Sorichetta et al (2015)).

Work is ongoing to integrate international cross-border migration flow data to construct a full international migration dataset at subnational scales (expected late 2016/early 2017).

Mapping urban change

Full details of the methodologies used to construct the datasets depicting estimates of population distributions in 2000 and 2010 that account for urban growth are in the following papers: Mertes et al (2014), and Schneider et al (2015). In brief, urban extents for 2000 and 2010 were mapped from Moderate Resolution Imaging Spectroradiometer (MODIS). GIS boundary-matched census data and city-specific population size estimates corresponding to the two time periods were then compiled, and the land cover-based population mapping approaches outlined above and here were applied, integrating the MODIS-derived urban extents, to produce 2000 and 2010 population distribution estimate datasets. The datasets were recently used as the basis for the World Bank’s East Asia’s Changing Urban Landscape report. Ongoing work as part of the Modelling and forecasting African Urban Population Patterns for vulnerability and health assessments (MAUPP) project is focussed on developing urban growth simulations for mapping future population distribution scenarios, and outputs from this work will be forthcoming in 2016. Additionally, the outputs of collaborations with the China CDC and World Bank will be provided in the form of temporal change population maps that incorporate urban change data.

Population distribution changes between 2000 and 2010 for the Hanoi region of Vietnam

Mapping poverty

Full details of the methodologies used to construct the datasets depicting estimates of the proportion of the population living in poverty in each grid cell will be forthcoming in a paper, but are outlined in broad terms here. In brief, GPS located national household survey data were obtained through either the Demographic and Health Surveys (DHS) program or the Living Standards Measurement Study (LSMS) program and either $1.25 and $2 a day consumption-based poverty metrics or the Multidimensional Poverty Index (MPI) were calculated for each survey cluster. A Bayesian geostatistical modeling framework, following approaches constructed for the Malaria Atlas Project was then established to exploit spatiotemporal relationships within the data, leverage ancillary information from an extensive set of covariates, and rigorously handle uncertainties at all stages to generate robust output surfaces with accompanying confidence intervals. The figures below show example outputs for Nigeria, and further outputs can be found at www.fspmaps.com. Upcoming poverty datasets will provide Progress out of Poverty Index mapping and the integration of mobile phone call data records. Further details can be found on the case studies page.

Survey cluster locations and calculated poverty headcount for Nigeria LSMS 2010-11
Predicted per-grid cell poverty headcounts for Nigeria